A9 Math: The Long Version
Here, we'll give you the gory math details behind the "world according to you" in answer A9. You may wish to read the friendly explanation under A9 first.
Speeding Up AI Research
Answer A6 showed your distribution for the arrival of AI. It took into account your estimates of the difficulty AI technologies would have with current researchers. But it did not take into account technology creating more effective researchers. Answer A9 does.
The way we get the result is a little more complicated than the previous times.
What Year It "Really" Is
Suppose that, on your assumptions, AI would have arrived in 2060. But suppose that, by 2050, because of intelligence enhancement, smarter scientists created ten extra years' worth of progress. Then AI arrives in 2050.
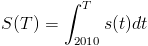
More generally, for each year
 , we'll need a probability distribution for what year
  it "really" is. This depends on how many "science years"
  were achieved in each past year
  :
:
How Much Research Gets Done
So how many "science years" happen in a year? It depends on a few things.
1. N years ago, how many babies with enhanced research ability were conceived as a result of iterated embryo selection?
2. Given genetics knowledge available N years ago, what's the factor by which embryo-selected children conceived then will be more effective?
These steps are repeated for every N that's at least 20. (We're assuming people under 20 don't contribute to research, and people over 20 don't die or retire before the model ends in 2070.) All these numbers are added to a constant base number of researchers.
3. Right now, by what factor do other intelligence enhancement technologies increase everyone's research ability?
This last unknown factor multiplies the total we get from 1 and 2. The factor has a value every year. But it's not reset every year: instead, at the beginning of time, a value is rolled up, once. The factor, by the end year 2070, ends up having a lognormal distribution with a mean and s.d. (for the log) given by your choices of mu and sigma in question Q9. At the start year 2010, the factor is 1. In between, the mean and s.d. (for the log) increase linearly from 0 and 0, to the mu and sigma you entered.
(Keep in mind that what comes out of our model isn't one random run of history. It's how the outcomes of all possible runs are distributed; the math that determines this distribution isn't itself random.)
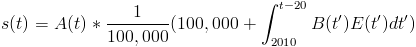
The outcome is some number of researcher-equivalents. We assumed the base number of researchers is 100,000. The ratio of these numbers is the number of "research years" that have gone by. Note that we're assuming a million researchers all working at the same time for one year are as effective as, for example, a thousand researchers working at the same time for a thousand years. We're also assuming that embryo-selected researchers add to the existing number of researchers instead of displacing them.
In math, if A is the speedup from other enhancement technology, B is the number of embryo-selected future researchers conceived per year, and E is their effectiveness,
How Many Selected Scientists?
Step 1 above asked how many people selected for science were conceived in a given year. That depends on two questions you answered: Q9-2 and Q9-4.
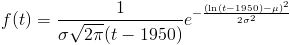
Q9-2 asked how long until artificial gametes. You entered two parameters, a mean mu and an s.d. sigma, which together determine a lognormal distribution. The probability density that this happens in year t is:

Q9-4 asked about the scale on which this technology gets adopted. The 0 to 50 years on the horizontal axis represent the number of years after the technology first gets adopted. This starting point is the one that was randomly set in Q9-2. Again, the scale of adoption has a value every year, but the value doesn't get reset every year. At the beginning of time, a value ("adoption-proneness") is rolled up once. The mean and standard deviation you set for 0 and 50 years afterward determine, as a linear function, a mean and standard deviation of the logarithm of a birth rate for all the years in between. At each year, the scale of adoption ends up being lognormally distributed. As before, if the scale ends one s.d. higher than you expected, it's always one s.d. higher than you expected.
How Effective is Selection?
Step 2 above asked how effective researchers selected for science ability are. That depends on two questions you answered: Q9-1 and Q9-3.
Q9-1 asked how long until $1000 genomes. You entered two parameters, a mean mu and a standard deviation sigma, which together determine a lognormal distribution: The probability density that this happens in year t is:
Q9-3 asked about the effectiveness factor of each embryo-selected scientist — that is, the number of typical scientists one of them could replace. The 0 to 50 years on the horizontal axis represent the number of years after we first become able to sequence genomes for $1000 or less. This starting point is the one that was randomly set in Q9-1. Again, the effectiveness factor has a value every year, but the value doesn't get reset every year. At the beginning of time, a value ("effectiveness-proneness") is rolled up once. The mean and s.d. you set for 50 years afterward, together with the fact that it starts at 1 (or in other words, the mean and s.d. of the log start at 0), determines, as a linear function, a mean and s.d. for all the years in between. At each year, the effectiveness factor ends up being lognormally distributed. As before, if the effectiveness factor ends one s.d. higher than you expected, it's always one s.d. higher than you expected.
Summary
In sum:
- Whether AI has been invented depends probabilistically on how many "research years" have taken place, with some distribution we found in A5.
- How many "research years" have taken place is determined by how many "research years" took place in each past year.
- How many "research years" took place in some past year T is determined by:
- some fixed constant representing a base of unenhanced researchers
- the number of researcher-equivalents from N-year-old embryo-selected researchers, for all N at least 20
- the multiplier, in year T, from other intelligence enhancement technologies
- How many researcher-equivalents are available in year T from N-year-old embryo-selected researchers is determined by the scale of adoption of iterated embryo selection in year T-N, and the effectiveness factor from genetic knowledge in year T-N.
- The scale of adoption of iterated embryo selection in year T-N depends on the time since the technology first became available, start and end parameters for a lognormal distribution, and a constant "adoption-proneness"
- The effectiveness factor from genetic knowledge in year T-N depends on the time since $1000 genomes first became available, end parameters for a lognormal distribution, and a constant "effectiveness-proneness"
All random variables here are independent, with the following exceptions. "Adoption-proneness", at different times, is perfectly correlated; "effectiveness-proneness", at different times, is perfectly correlated; and the multiplier from other intelligence enhancement technologies, at different times, is perfectly correlated.
Putting all these steps together, we find our final distribution for A9, which is shown in the graph.